
One teacher asked me about the Archimedes Principle laboratory exercise that I've published. Basically, I graph the amount of mass floating in a cup as a function of the volume of water displaced. From the slope it's possible to get a value for the density of water.
This teacher was concerned... his students' measured densities varied all over the place, in many cases exceeeding the density of gold. We talked about experimental technique, and I gave him some hints there. (It's important to be absolutely sure the cup is filled to the brim.) But he was doing a reasonable job with the procedure, and he shouldn't have had such a crazy spread of densities.
Then I asked him about his students' analysis. I wondered how linear their data were. It came out of the discussion that his students were measuring the displaced volume for just 4-5 different floating masses. THERE'S THE ISSUE!
When my classes come to the first lab of the year, they expect to take 4-5 overly precise data points, and then spout some baloney about "human error" being why their result is lousy. It takes a couple weeks of me riding herd and establishing the proper tone in order to get good, solid results. Some of my rules for laboratory include:
1. No one leaves early; no one may work on anything but physics during the entire 90-minute lab period. So there's no hurry to get done.
2. Data is placed directly on a graph as acquired. We do not make a table of values to graph later. Why not? (a) See rule #1. (b) It's hard to convince a student who's put everything away and *thinks* he's alredy done to do more work. If they're graphing as they go, then it's easy to see when the graph looks complete, or in which range more data needs to be acquired.
3. The standard for a "complete" graph isn't a certain number of points. Rather, it's the "little brother" standard -- could your 6 year old little brother look at the graph and tell INSTANTLY whether it's a line or a curve? And would all his little 6 year old friends agree with him unquestionably? If not, more data is necessary.
4. It's not acceptable to measure the same data point twice. Consider a period of a pendulum experiment. My students' instincts at the beginning of the year are to measure the period for five different lengths, and to time each length 4 or 5 times. That's silly... why not just make a single measurement of the period for each of 20 different lengths? Any "errors" in timing will smooth out over the entire graph.
5. NO PUTZING. Early on, I go through the class speeding the data acquisition process. For example, partnerships will spend 15 minutes arguing whether to measure periods for every 5 cm of string length, or for every 10 cm. If they had just started measuring, they would have had time to measure every 2 cm!
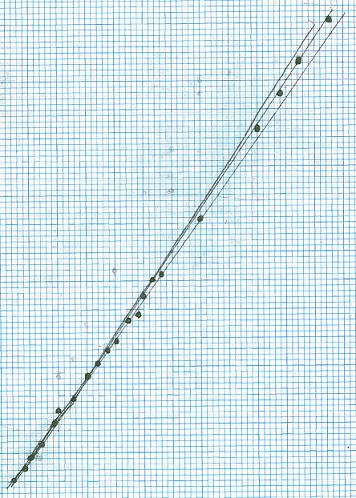
Look at the graph above. I deliberately cut off the axis labels, becuase the issue is the number and linearity of the points. Graphs for all experiments look this way. Most of my experiments require a good hour plus for data aquisition. That's time well spent, becuase then the analysis goes smoothly with minimal deviation from the answers I expect. As the year goes on, data aquisition becomes smooth, effortless, and fast.
Try it -- lab should be a fun and relaxed experimental investigation, not a race to see who can just get the friggin' thing done first.
GCJ
Tidak ada komentar:
Posting Komentar