I had just introduced the idea of a force acting at an angle in my general physics course. I needed an experiment for lab day.
In general physics lab, I want as often as possible to be able to make a linear graph, and use the slope or intercept to calculate a verifiable physical quantity. The data collection process should be as simple as I can make it -- very little messing with computers, with minimal calculation before the linear graph appears.
My first thought was to use the PASCO fan cart. The fan can blow straight ahead, or can blow at any angle all the way to 90 degrees off of straight ahead. If we place this cart on a PASCO track -- with grooves keeping the cart from sliding -- a spring scale attached to the front of the cart can measure the force the cart experiences in the direction of the track. This force would be equal to the force of the fan times the cosine of the fan angle. A graph of the scale reading vs. the cosine of the fan angle would make a line whose slope is the force of the fan.
Problem is, I have 22 students and 11 lab groups. I don't even have two fan carts, let alone 11; that many fan carts would bust my budget.
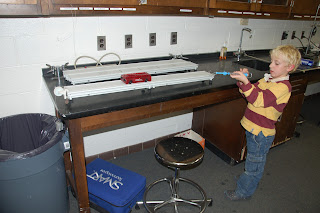
After considerable brainstorming with some AP physics alumni, a new thought occurred to me... what if I could keep the angle of an applied force constant? Look at the lower picture, the picture of the red PASCO cart. This is one of the newer plastic "pascar" models. It has several convenient raised thingamabobbers (that's a technical term) useful for attaching strings.
One string is attached to the middle of the left-hand side of the cart. This string is passed over a pulley, and a hanging weight is hanged from the string. A second string is held across the diagonal of the rectangular pascar, as shown in the picture. The geometry of the pascar itself determines this angle -- students are instructed to ensure that the rope stays along the diagonal to control the angle. A spring scale is attached to the angled rope. The top picture shows the Nachoboy holding the spring scale at the correct angle; the hanging weight is visible above the garbage can. Component analysis shows that the hanging weight is equal to the tension in the angled rope times the cosine of the string's angle.
Students vary the hanging weight, and measure the tension in the angled rope with the scale. They graph the hanging weight vs. the tension in the angled rope. The slope of this graph should be the cosine of the angle of the string!
Each student used the slope of his graph to figure out the angle of the rope. I measured the angle with a protractor... I got between 21 and 24 degrees, depending on where the rope was anchored. Those who did the experiment carefully (most of the class) got a slope of 0.90-0.95... giving an angle between about 18 and 25 degrees. Woo-hoo!
GCJ


Tidak ada komentar:
Posting Komentar